WLP Reporting gives you valuable insight into the needs of your employees. With this knowledge, you can tailor your workplace health promotion measures to the needs of your workforce, plan based on data, and take your health management to the next level.
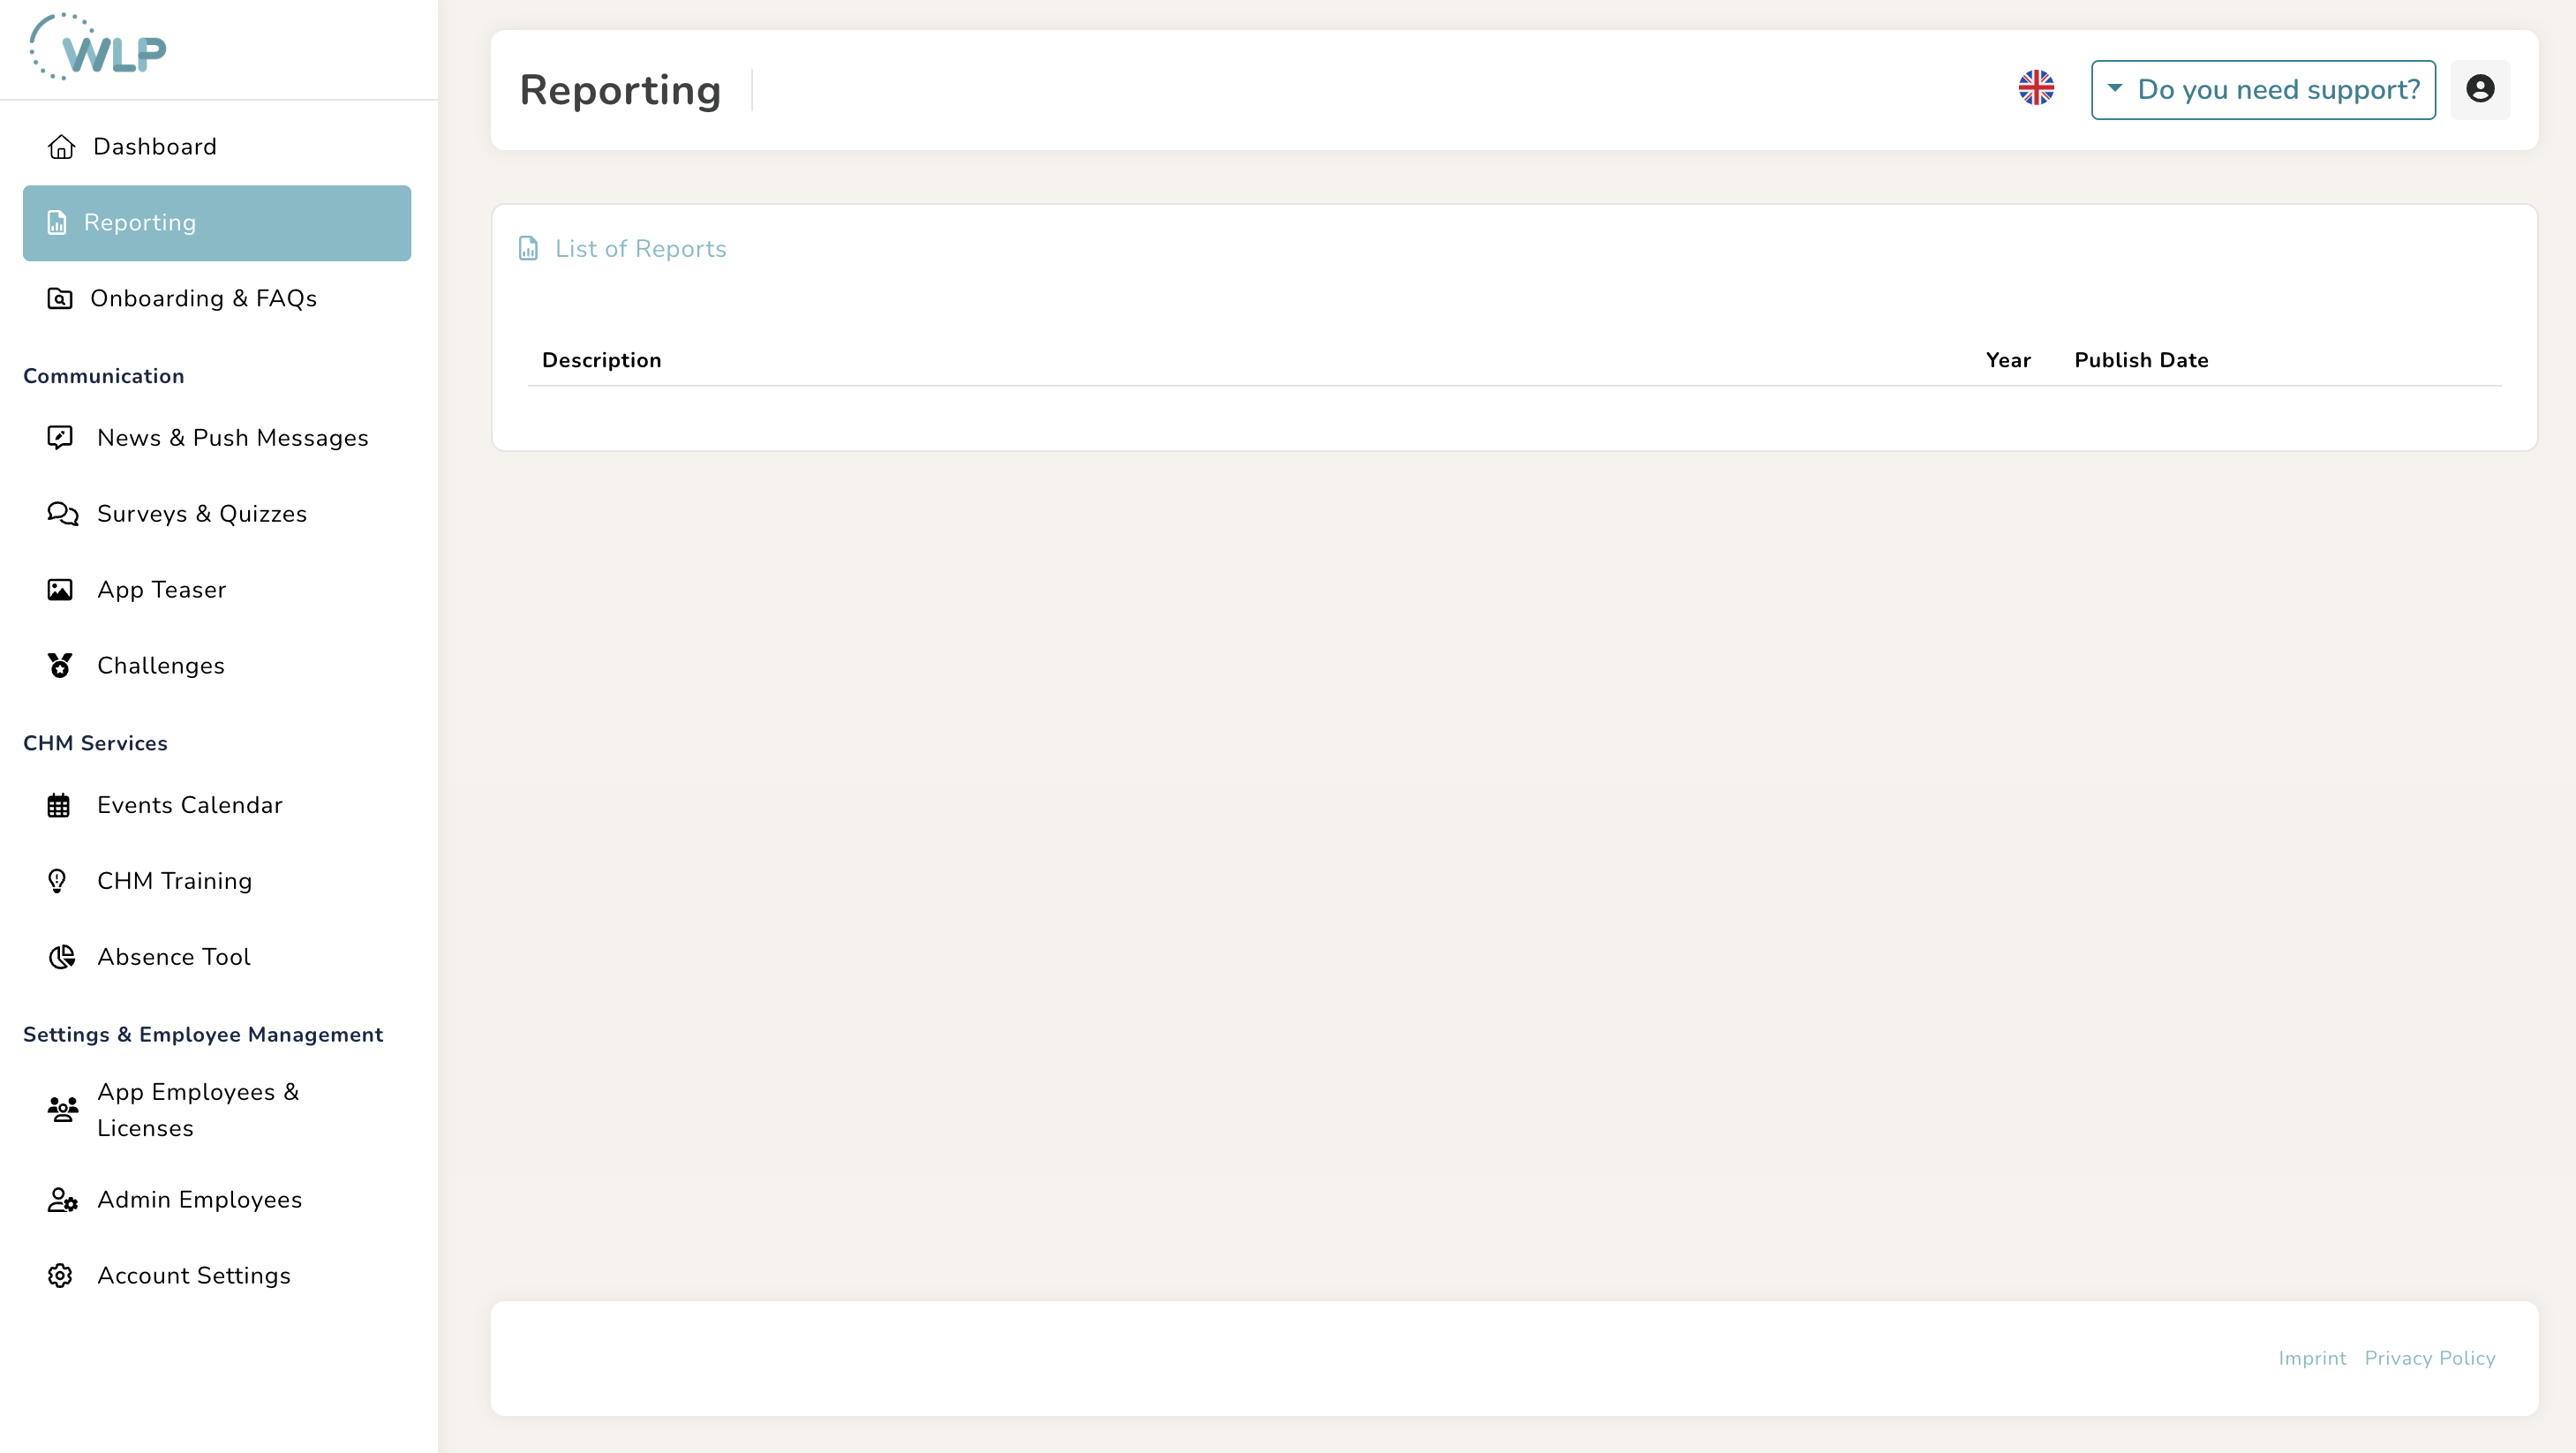
To view your key figures, simply click on the “Reporting” menu item. There you will find an overview of the reports available to you. Your report is generated once a quarter. You can easily download it as a PDF file with a single click. The premium version of the WLP report is also available as an Excel file, allowing you to perform your own evaluations.
The report contains the following metrics:
- Inquiry rate (proportion of requested WLP IDs)
- Registration rate (proportion of activated WLP IDs)
- Content consumption per topic area, including comparison per quarter and with the WLP average
- Average number of steps per user, including comparison per quarter and with the WLP average
- Top 5 health goals
- Age and gender distribution of users
- Key events in quarterly comparison
- Key events per user
- Comparison of weekly vs. monthly usage by employees
- Content consumption by topic area, including comparison per quarter and to the WLP average
- Top 3 most popular topics
- Top 3 least popular topics
Please note that you must have at least 5 active licenses in order for us to provide you with a reporting. This is the only way we can ensure that your reporting remains anonymous.
Note
The report is generated as soon as a minimum usage period of one month has been guaranteed within a quarter. So, if you started using the app in the second quarter of the year and used the WLP app in your company for a full month, you will see your report in your Backoffice in the following quarter.
Was this article helpful?
That’s Great!
Thank you for your feedback
Sorry! We couldn't be helpful
Thank you for your feedback
Feedback sent
We appreciate your effort and will try to fix the article